Zapier’s Hard-Won Eval Lessons
In a recent presentation at AIE, Rafal Wolinski and Vitor Balocco shared how they set up evaluations for Zapier. Given how new evaluations are for everyone, I thought it would be interesting to examine the approach Zapier’s took and see how it compares to how I run Evaluation, based on what I learned from with Shreya and Husain. I'm interested to see what the differences are, where they present and why they exist.
My approach to running eval involves (written more about this here):
- First, instrument your application
- Then establish your failure modes
- Figure out how prevalent each error type is
- Either with code-based evaluators
- Or LLM-as-Judge Evaluators
- Then iterate on your prompt till you fix the problem. The goal is 90%> True Positive Rate (TPR) and True Negative Rate(TNR).
Based on their presentation, Zapier's approach involves:
- Build a data flywheel
- Look at the raw data
- Group your failure modes
- Write your Evals
What stood out most to me was how much Zapier emphasised dataset building and instrumentation. Nearly half of their discussion focused on setting up the runs correctly, which I think reflects reality far more accurately than the common assumption that you simply set up a tool and start running evaluations. In my experience so far, "running evaluations" is setting up the tooling. They called this step...
Building the data flywheel
Once your user starts using your product, you need to collect feedback to begin understanding usage patterns and any issues that arise. From there, you can build more evals, deepen your understanding of what's failing, and identify the key use cases. As you add more evaluations and features, your product improves, which attracts more users, leads to more failures, and necessitates even more features. On and on it goes, forming this data flywheel.
How they collected actionable feedback
Tracing completion calls is a good start, but you also want to make sure that you're recording the tool calls, the errors from those tool calls, and the pre- and post-processing steps.
That way, it will be much easier to debug what went wrong with the run. You also want to strive to make the run repeatable for eval purposes. For instance, if you log data in the same shape as it appears in the runtime, it makes it much easier to convert it to an eval run later because you can pre-populate the inputs and expected outputs directly from your trace for free.
This is especially useful for tool calls because if your tool call produces any side effects, you probably want to mock those in your evals. You get all that for free if you're recording them in a trace. So, you’ve instrumented your code and started getting all this raw data from your runs. Now it's time to figure out which runs to actually pay attention to.
Explicit user feedback
Unfortunately, not many people actually click those classic thumbs-up and thumbs-down buttons.
So, you have to work a bit harder for that feedback.
In Zapier's experience, this works best when you ask for the feedback in the right context. You can be a little more aggressive about asking for feedback, but only if you’re doing it at the right moment.
So, while thumbs up and thumbs down are a good benchmark and a good baseline, try to find these critical moments in your users' journey when they’ll be most likely to provide feedback—either because they’re happy and satisfied or because they’re angry and want to tell you about it.
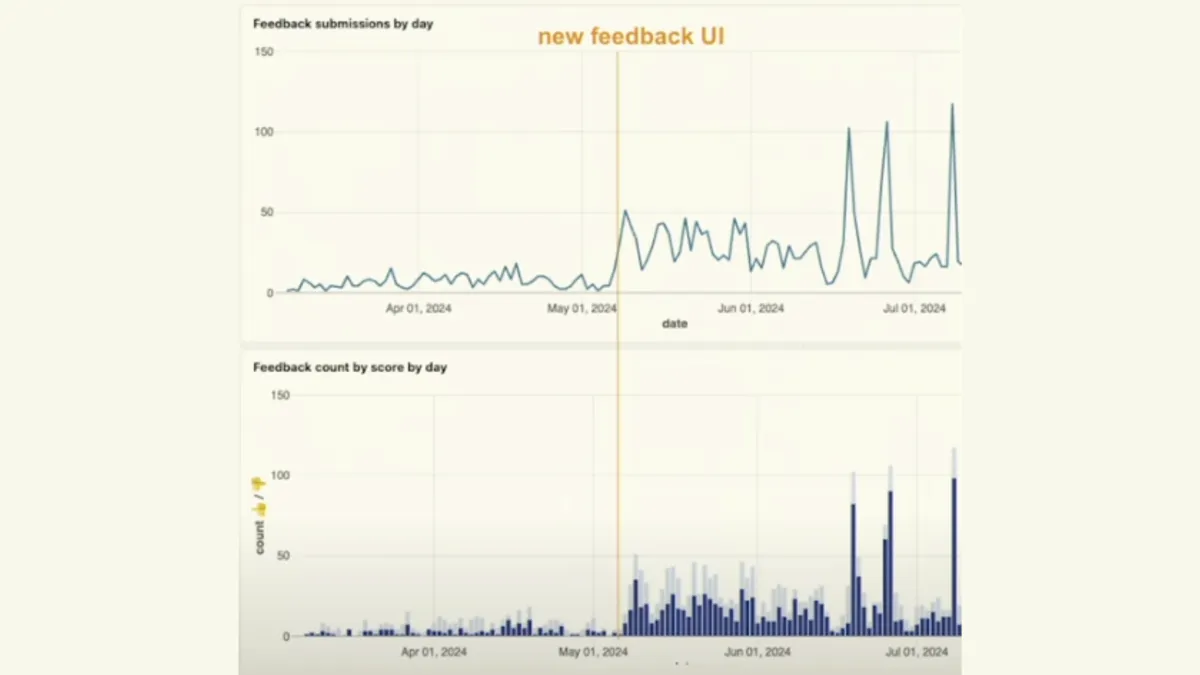
For them, one example of this is that once an agent finishes running, even if it was just a test run, they show a feedback call-to-action at the bottom: 'Did this run do what you expected?' Give us the feedback now. This small change actually gave us a significant increase in feedback submissions, surprisingly (a fourfold increase in submissions).
Even if you work really hard for feedback, explicit feedback is still rare. And explicit feedback that’s detailed and actionable is even harder to get, because people are just not that interested in providing feedback in general.
Implicit feedback
There are a few low-hanging fruit possibilities when it comes to collecting implicit feedback.
User behaviour in the UI Here’s an example from Zapier: users can test an agent before they turn it on to see if everything is working. If they do turn it on, that’s actually really strong positive implicit feedback. Copying a model's response is also good implicit feedback—even OpenAI is doing this for ChatGPT.
Frustrations You can also look for implicit signals in the conversation. For instance, if a user tells the agent to stop “slacking around,” or starts cursing, that’s clearly implicit negative feedback. Sometimes, a user sends a follow-up message that mostly rehashes what they asked the previous time, to see if the LM interprets that phrasing more effectively. That’s also good implicit negative feedback.
Recently, Zapier had a lot of success using an LLM to detect and group frustrations, and now they post a weekly report in their Slack. But it took a lot of tinkering to make sure the LLM understood what “frustration” means in the context of the product (if you try this out, expect plenty of tinkering).
User metrics You should also not forget to look at more traditional user metrics. There’s a lot of useful implicit signals to mine there, too. Find what metrics your business cares about and figure out how to track them. Then, you can distil a signal from that data.
For example, you can look at customers who churned in the last seven days and examine their last interaction with your product before they left—you’re likely to find valuable insights there.
I found Zapier's emphasis on implicit feedback refreshing—whether through UI signals, user interactions, or business metrics—to help isolate where to look. That’s something I definitely want to incorporate, since it wasn’t a big focus in Shreya and Hamel’s course.
Now that you have raw data, how do you look at it?
Zapier uses off-the-shelf LMOps software and they built their own custom dashboards.
Building your own LMOps dashboard is worth exploring if you have a complicated flow of information through your product. You need to understand each agent run. A single agent run can involve multiple LM calls, multiple database interactions, tool calls, REST calls—whatever it may be. Each one of them can be a source of failure, and it’s really important to be able to piece together the whole story to understand what caused a cascading failure.
Also, coding your own internal tooling is really easy right now with Cursor and Claude Code. A custom tool gives you the ability to understand your data in your own specific domain context. It allows you to create functionality that turns every single interaction or failure into an eval with minimal friction. Whenever you see something interesting, there should be a one-click option to turn it into an eval.
Once you understand what’s going on at the level of a single run, you can start understanding things at scale.
Grouping Failure Modes
You can bucket your failure modes and your interactions, and then you’ll start to see what kinds of tools are failing the most and what kinds of interactions are the most problematic. This creates an automatic roadmap for you—you’ll know where to apply your time and effort to improve your product the most.
Reasoning models can help explain failures. If you give them the trace output, input, instructions, and anything else you can find, they’re often good at finding the root cause of a failure. Even when they don’t see the exact cause, they can explain the run or direct your attention to something important that helps you track down the problem. Now you have a good shortlist of failure modes you want to work on first. It’s time to start building out your evals.
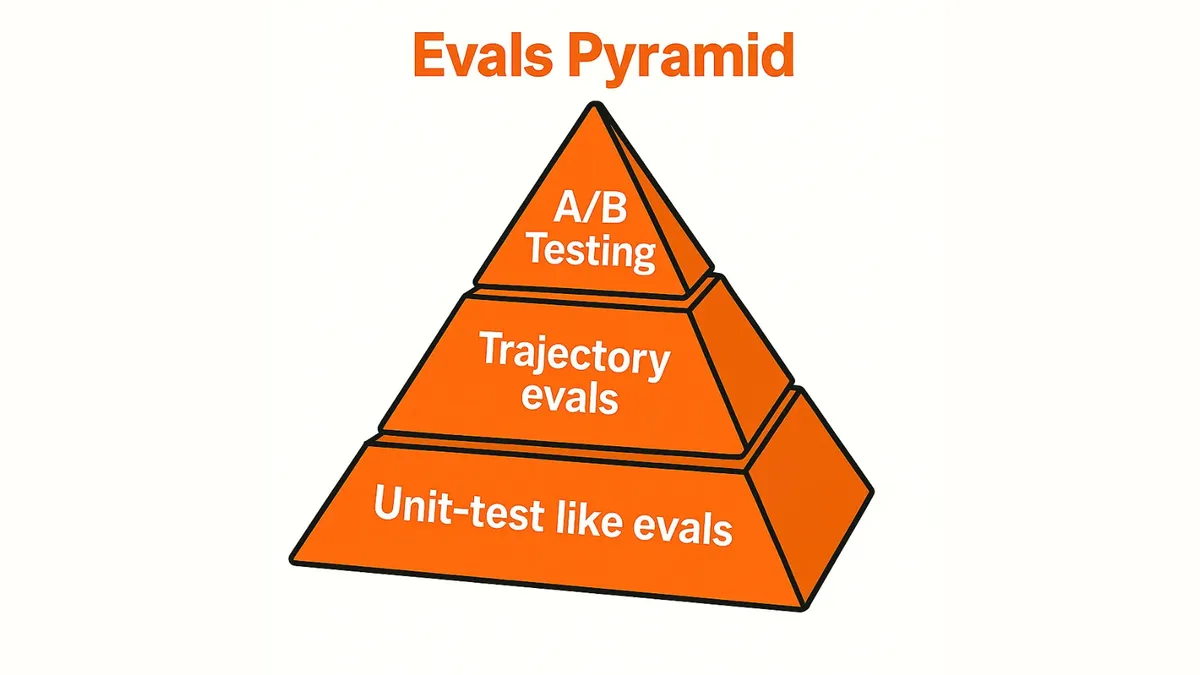
The Evals Pyramid
I've only categorised evals as “code-based” vs. “LLM-as-judge". Zapier framed things as unit-test evals for single completions, trajectory evals for end-to-end outcomes, and rubric-based evals for more nuanced LLM judgments. On top of that, they present A/B testing as the ultimate benchmark, with regression datasets catching failures and aspirational datasets driving offensive improvements.
Let’s start with unit-test evals! These focus on predicting the next state from the current state. They’re great for simple assertions. For instance, you can check whether the next state is a specific tool call, whether the tool call parameters are correct, whether the answer contains a specific keyword, or whether the agent determined that it was done.
If you’re just starting out, Zapier recommends focusing on unit-test evals first because they’re the easiest to add. They help you build the muscle of looking at your data, spotting problems, creating evals that reproduce them, and then fixing them.
Just be cautious about turning every positive feedback instance into an evaluation. They found that unit-test evals are best for climbing out of specific failure modes you identify in your data. These evals are fine-grained, so over-indexing on them makes it hard to see the forest for the trees when benchmarking new models.
Different models have different ways of achieving the same goal, and unit tests penalise alternate paths. Zapier was essentially overfitting to their existing models and the data collected from them.
Trajectory evals Instead of grading a single iteration of an agent, Zapier also lets the agent run to the end state, grading not just the final output but also all the tool calls and artefacts generated along the way. This was more of an end-to-end eval test.
Trajectory evals are not free. They are much harder to set up—especially if you are evaluating runs that involve tools causing side effects. These runs are also much slower, sometimes taking up to an hour, which is not ideal. But they have a really high return on investment.
Zapier decided against mocking the environment because that would produce data that didn't reflect reality. Instead, they mirror the user’s environment and craft a synthetic copy of it. For example, when you’re running an eval, you don’t want to accidentally send an email on behalf of a customer again.
This end-to-end approach can also be paired with LLM-as-a-judge. This is when you use an LLM to grade or compare results from your evals. It’s tempting to use it everywhere, but you need to make sure the judge is judging correctly, which can be surprisingly hard. You also have to be careful not to introduce subtle biases, because even small overlooked details can influence the results.
Rubric-based scoring When Zapier uses an LLM to judge the run, each row in the dataset has a different set of rubrics. These rubrics are handcrafted by humans and written in natural language to describe what specifically the LLM should pay attention to. For example: Did the agent react to an unexpected error from the calendar API and then try again?
This rubric-based approach to using LLM-as-a-judge evals makes a lot of sense to me because it mirrors how I first started thinking about LLMs as judges.
A/B test evals
Taking a step back, the whole point of creating evals in the first place isn’t to maximise some imaginary number in a lab—it’s user satisfaction. The ultimate judge is your users.
Zapier believe the ultimate verification method is an A/B test: take a small portion of your traffic, route it to the new model or prompt, monitor feedback, check activation and retention metrics, and make decisions based on that. It’s a far better approach than just optimising numbers in isolation.
To sum it up, Zapier's current mental model of the types of evals they build for is:
- Unit-test evals debug specific failures and help hill-climb them, but beware of overfitting.
- Trajectory evals capture multi-turn criteria.
- A/B test evals validate improvements directly against user satisfaction and real-world metrics.
This new way of thinking about Eval as either single or multi-turn tests, where either can be code or judged by an LLM, added a new dimension to my “code-based” vs. “LLM-as-judge” perspective.
Something else Zapier is starting to experiment with is dividing the dataset into two pools:
- Regressions dataset – to ensure changes don’t break existing use cases.
- Aspirational dataset – for extremely hard cases, like nailing 200 tool calls in a row.
This echoes the summary I wrote about using evals more offensively.
A couple of closing thoughts from Zapier were to not obsess over metrics. Remember, when a good metric becomes a target, it ceases to be a good metric. If you’re close to 100% on your eval dataset, it doesn’t mean you’re doing a good job—it probably means your dataset isn’t interesting anymore. We don’t have AGI yet, so your model almost certainly isn’t that good.
That’s all.
Sources
- Rafal Willinski and Vitor Balocco's talk at AIE
- A post on Rafal's blog where he talks about the Eval Pyramid.